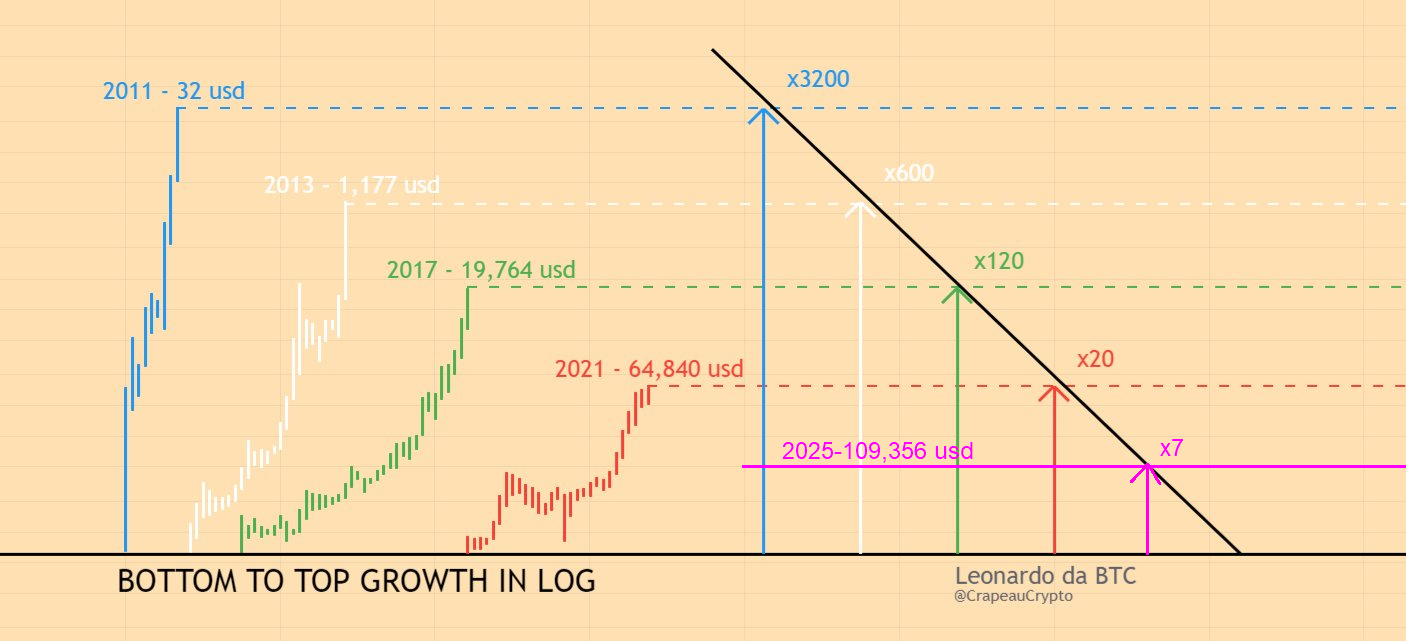
>>60581261 (OP)this has to be the most retarded chart going around for a long time. It's just a drawing. you can literally do this with any asset. and any X multiple.
you just take the first two bull run fractals and make a line and fit the next and the next one and the next one under the line.
it doesn't predict anything and literally just tells you what the price chart is already telling you and basic market fundamentals. Yeah bitcoin is a 2 trillion dollar asset now.
It is going up in smaller multiples every bull run if you want to chop up bull runs like that. Or you could say its just been one 10 year long bull run and its still going up.
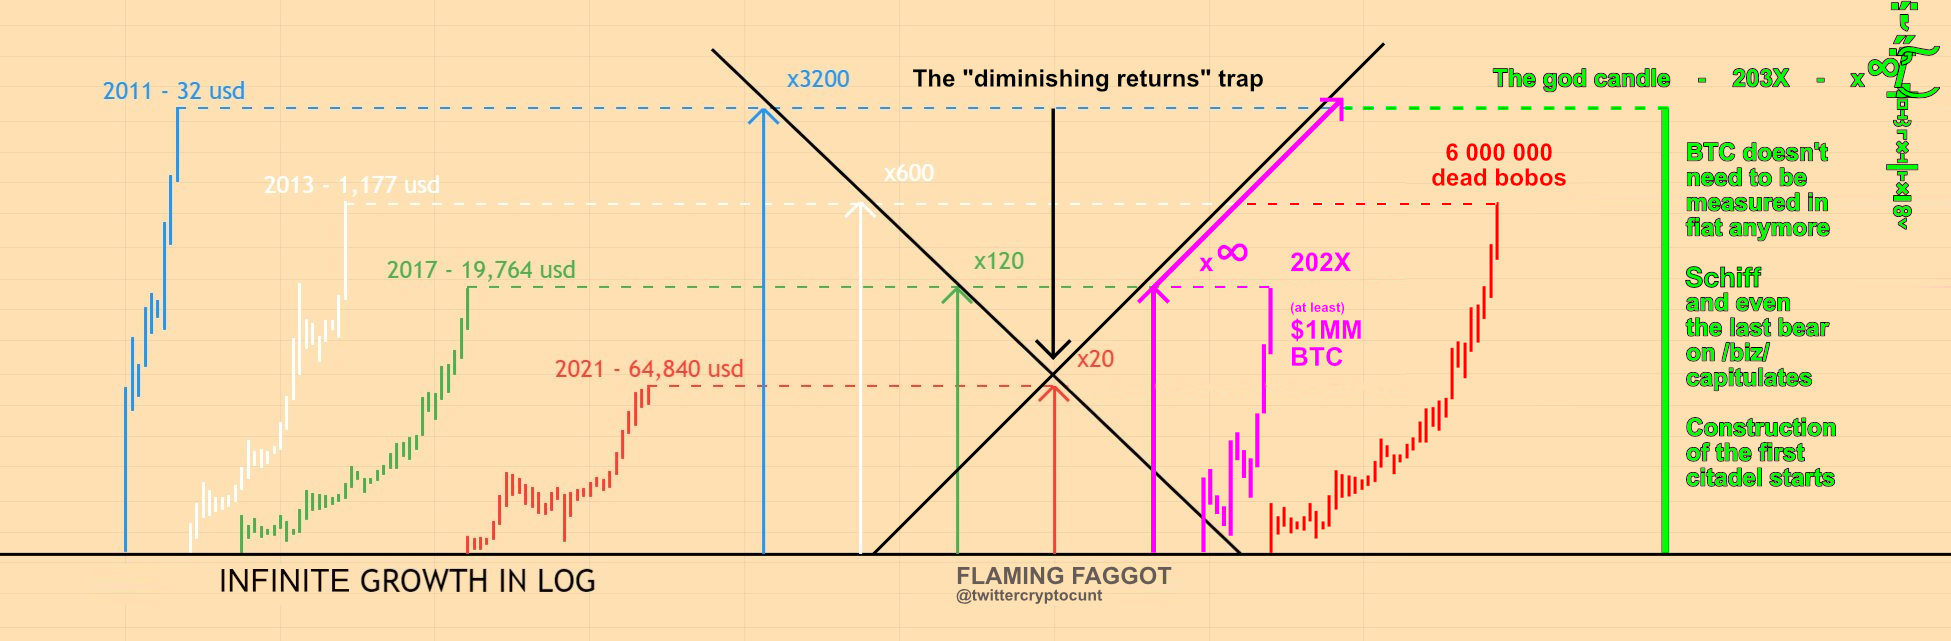
What if this is just showing the flattening part of the S curve adoption and the multiples will start going up with each cycle.
This chart isn't even basic TA