4rchive
[
Home
] [
Feed
] [
Search
]
Post Content (fulltext)
Post Content (exact)
Thread Title (fulltext)
Thread Title (exact)
Author
Image MD5 Hash
All Boards
3
a
aco
adv
an
b
bant
biz
c
cgl
ck
cm
co
d
diy
e
fa
fit
g
gd
gif
h
hc
his
hm
hr
i
ic
int
j
jp
k
lgbt
lit
m
mlp
mu
n
news
o
out
p
po
pol
pw
qst
r
r9k
s
s4s
sci
soc
sp
t
tg
toy
trv
tv
u
v
vg
vip
vm
vmg
vp
vr
vrpg
vst
vt
w
wg
wsg
wsr
x
xs
y
Search results for "1a9f968b18f9f1ff5618fdaaa3785924" in md5 (1)
/pol/ - /chug/ - Comfy Happening in Ukraine General #21180
Anonymous
8/6/2025, 5:29:21 PM
No.512377661
file.png
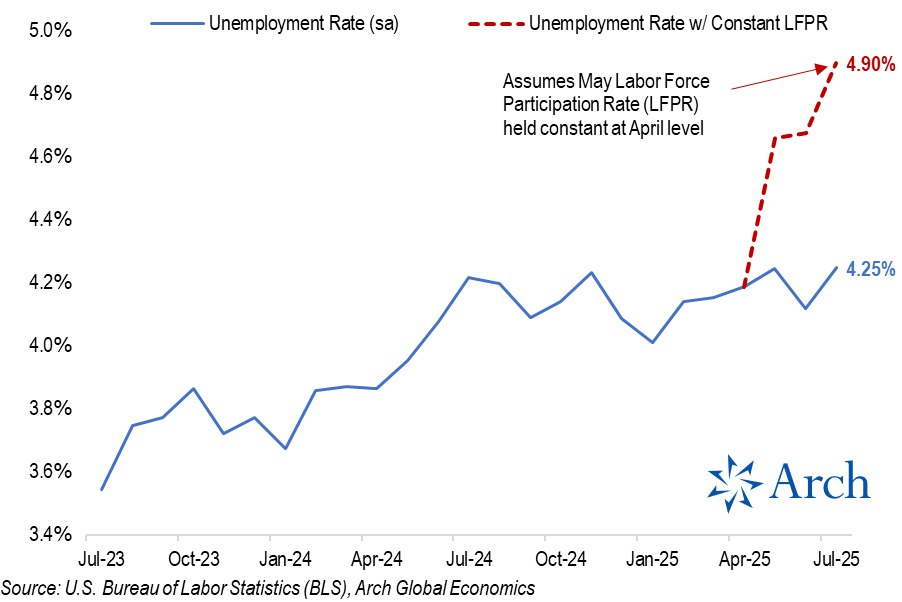
Can someone explain this chart to me?
 8/6/2025, 5:29:21 PM
No.512377661
8/6/2025, 5:29:21 PM
No.512377661