>>61090782
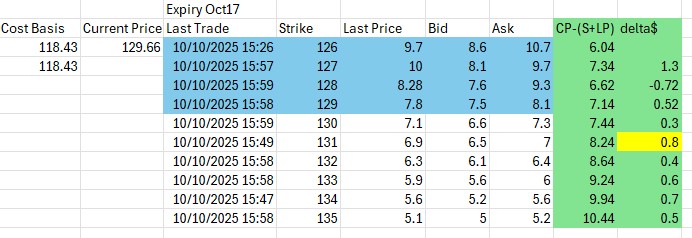
Ok, I have my regular investments, and do some swing trading. I like to run the wheel on some stocks and for those I simply want the most premeium and to keep the wheel spinning so I like to sell close to the current strike price. I use the premiums to buy volatile stocks so the price increase of the volatile stock is more than anything I risk running the wheel, provided I make enough premium before the stock shits the bed and I get stuck (I do not buy puts to cover, it reduced the premium I make. I only wheel stocks I am fine holding for weeks to months to price recovery and I start again). I noticed some options premium opportunities where the rate of increase in premium is higher and I would like to simply sell that before it adjusts. In the schwab web app I can only see one strike (per expiry date) at time. I checked thinkorswing and they do not let me make my own calcualted columns ( I dont care about the greeks). I want to be able to pic a ticker, choose how man strikes I want to see for say 3,4,5 expiry dates (all close maybe 5-6 weeks out only), then be able to have my own calcualted columns where I see the change in premium difference. See pic, yellow box. Yes, I know it keeps generally increasing the higher you go but its the bigger increase closer to the strike that I am interested in. The two green columns are my computed columns and I would like to be able to do some custom calcualtions (like you can do with PowerBI and Excel). The delta$ shown is not that much, but I have seen some that are more significant. For my own enterainment I am trying to make something like this for myself using the Schwab API but I am not a programmer and it may be too much for me. I wanted to pull down the options data into Excel or PowerBI then calculated columns would be easy. If this is fucking retarded let me know why you think so.