
>>513476615
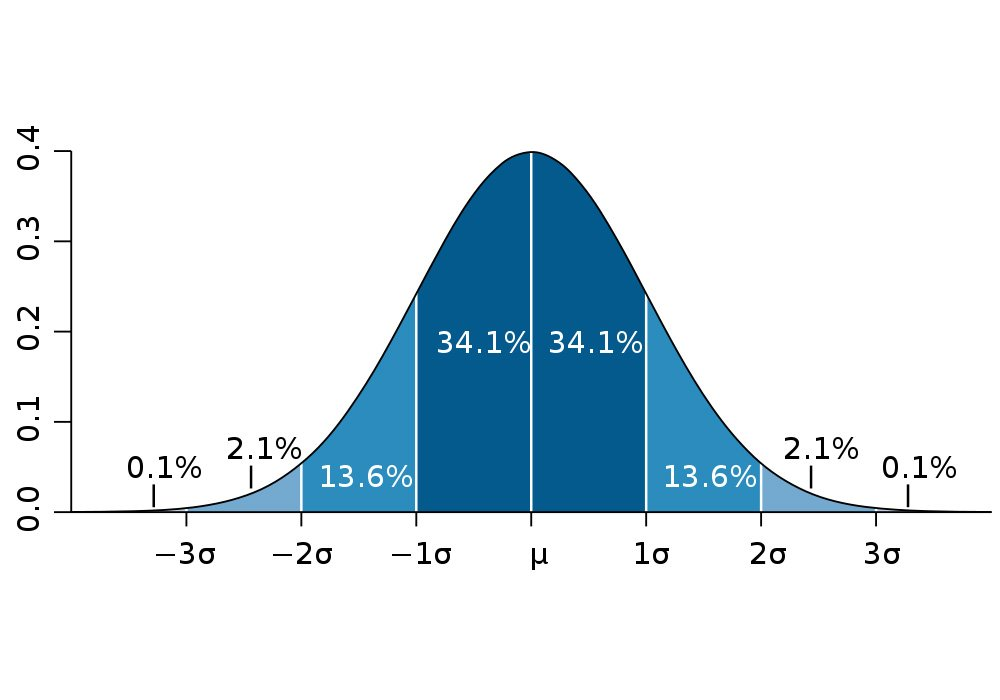
When you measure samples related to an event and you place them in a chart where the horizontal axis is the sample value and the vertical axis is the number of samples with that value, their values follow a probability curve, and for nature-related events they usually follow a "normal distribution" aka a bell, pic related.
In a probability curve with a normal distribution, the "mean" or Average Value sits at the center of the curve, and a "sigma" or Standard Deviation is the average distance between any random value and the mean. When you do the math about the number of values that fall within a certain distance from the center:
1 sigma covers 67% of the values
2 sigmas cover 95%
3 sigmas cover 99.7% of the values, which most studies round up as "practically every sample possible by the studied event under regular conditions"
any samples that are 24 fucking sigmas away from the event's average are practically not part of the same event under the same conditions, you're actually measuring a different event.
In this case, if the original event was "infant excess deaths since 1995 in the United States" and then you add the new samples to the existing distribution and realize the new samples fall at 24 sigmas in said distribution, then in reality the new samples belong to a different event, "infant excess deaths post-vaxxing in the United States".
4chan Search
1 results for "3e662ae6779a4992d77dfb3f7d7ffd03"