>>61085705
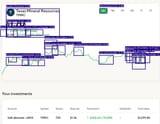
Based on recent data for Texas Mineral Resources Corp (TMRC), the 5-day chart pattern is a textbook demonstration of a Strong Uptrend or a Bull Flag continuation pattern.
1. The 5-Day Chart Pattern: Strong Uptrend / Potential Bull Flag
The most prominent feature is the significant percentage gain over the five-day period, as cited by technical data:
* Performance: The 5-day change is often reported as being between +22% to +34% (depending on the exact dates used for the analysis). This clearly establishes a short-term Strong Uptrend on the 5-day chart.
* Higher Highs and Higher Lows: Each day (or two) typically closes higher than the previous one, maintaining a distinct upward slope.
* Volume Spikes: The strong move is often accompanied by bursts of high trading volume, indicating strong buyer interest.
* A "Flagpole" and "Consolidation" (Bull Flag): In some instances within the 5-day window, or immediately following it, the sharp initial rise (the "flagpole") is followed by a period of sideways or slightly downward price movement (the "flag"). This is a Bull Flag—a continuation pattern.
2. Implications of the Pattern
Bullish Implication (Continuation):
* Strong Short-Term Momentum: The most immediate implication is that the stock has very strong short-term bullish momentum. Buyers are aggressively pushing the price higher, likely in reaction to recent news, market sector trends (rare earth/critical minerals), or a surge in speculative interest common in OTC stocks.
* Potential for Further Upside: If the pattern is a true Bull Flag, the expectation is that the price consoli...
In Summary:
The 5-day chart for TMRC exhibits a Strong Uptrend, often forming a Bull Flag continuation pattern. This signals powerful short-term momentum and the potential for the stock to continue its ascent. However, due to the magnitude and speed of the rise, the stock is considered high-risk and potentially overbought, necessitating extreme caution for any new trades.
