4rchive
[
Home
] [
Feed
] [
Search
]
Post Content (fulltext)
Post Content (exact)
Thread Title (fulltext)
Thread Title (exact)
Author
Image MD5 Hash
All Boards
3
a
aco
adv
an
b
bant
biz
c
cgl
ck
cm
co
d
diy
e
fa
fit
g
gd
gif
h
hc
his
hm
hr
i
ic
int
j
jp
k
lgbt
lit
m
mlp
mu
n
news
o
out
p
po
pol
pw
qst
r
r9k
s
s4s
sci
soc
sp
t
tg
toy
trv
tv
u
v
vg
vip
vm
vmg
vp
vr
vrpg
vst
vt
w
wg
wsg
wsr
x
xs
y
Search results for "a7f0c931b5e664798d830c4acb6e9048" in md5 (1)
/biz/ - /smg/ - Stock Market General
Anonymous
9/9/2025, 9:32:26 PM
No.60919622
1757446160093.jpg
>>60919591
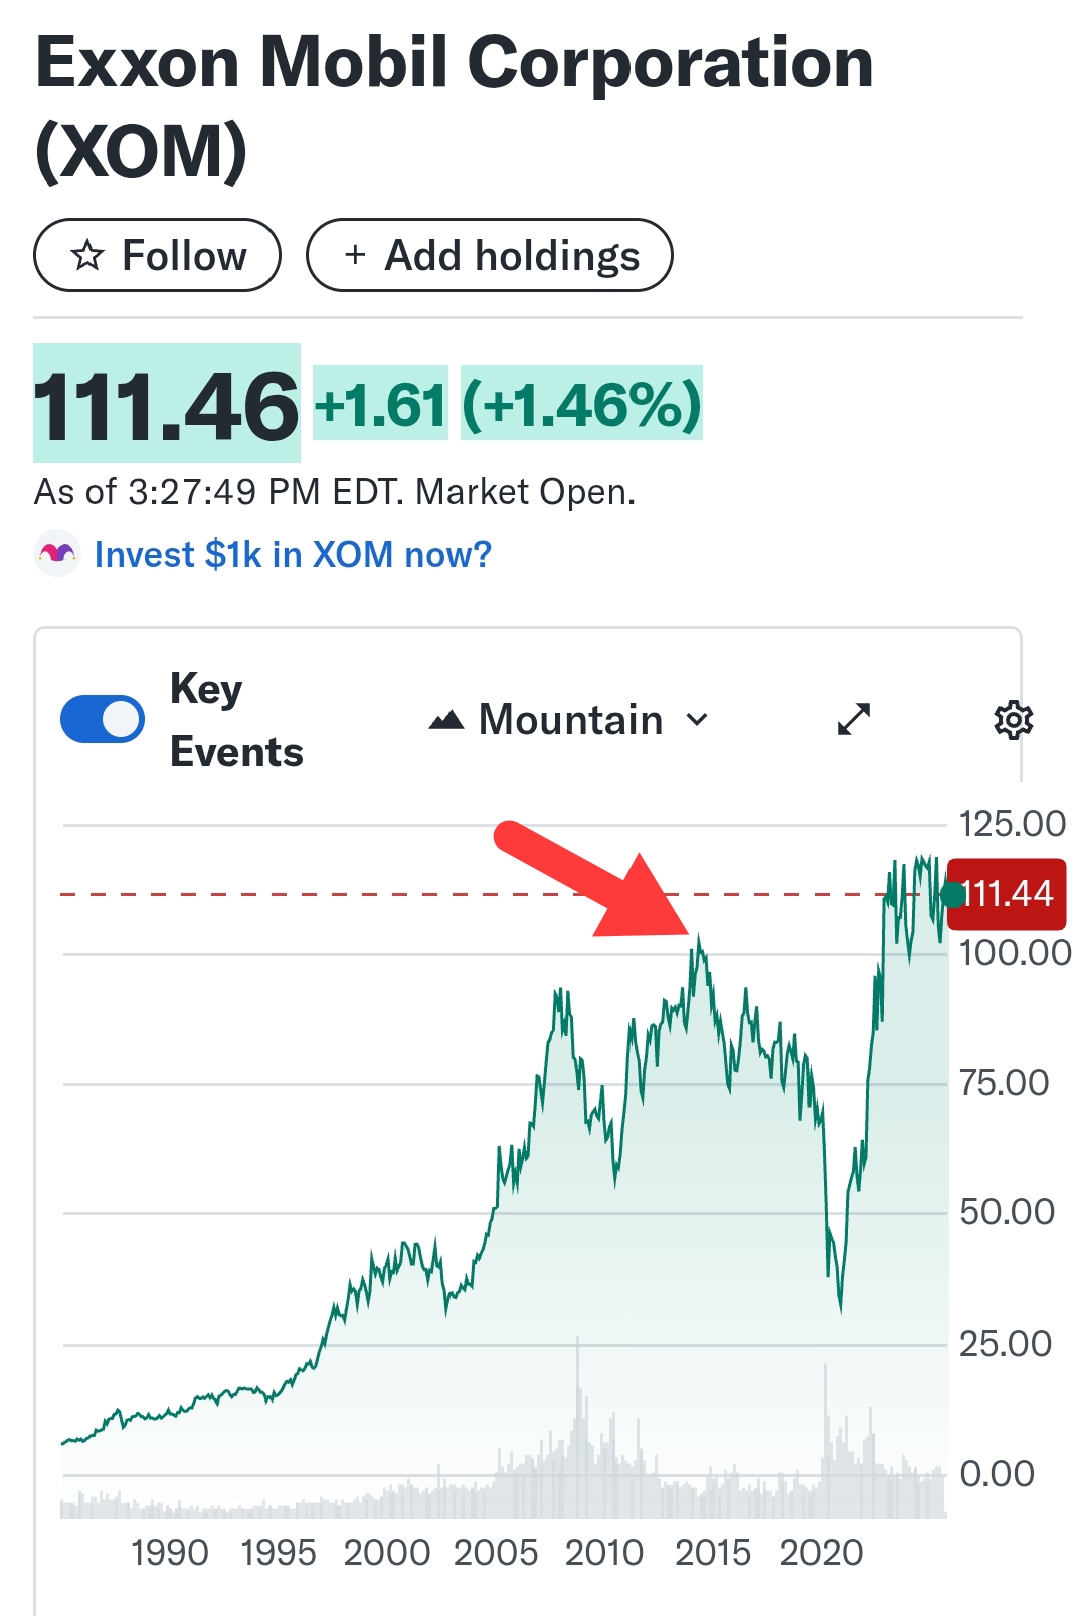
Ok zoom zoom. You see this graph. That's ExxonMobil. Big enough for you? Now imagine buying where the arrow is. Now look at the dates below and understand how long your capital is locked up as you wait for it to bounce back.