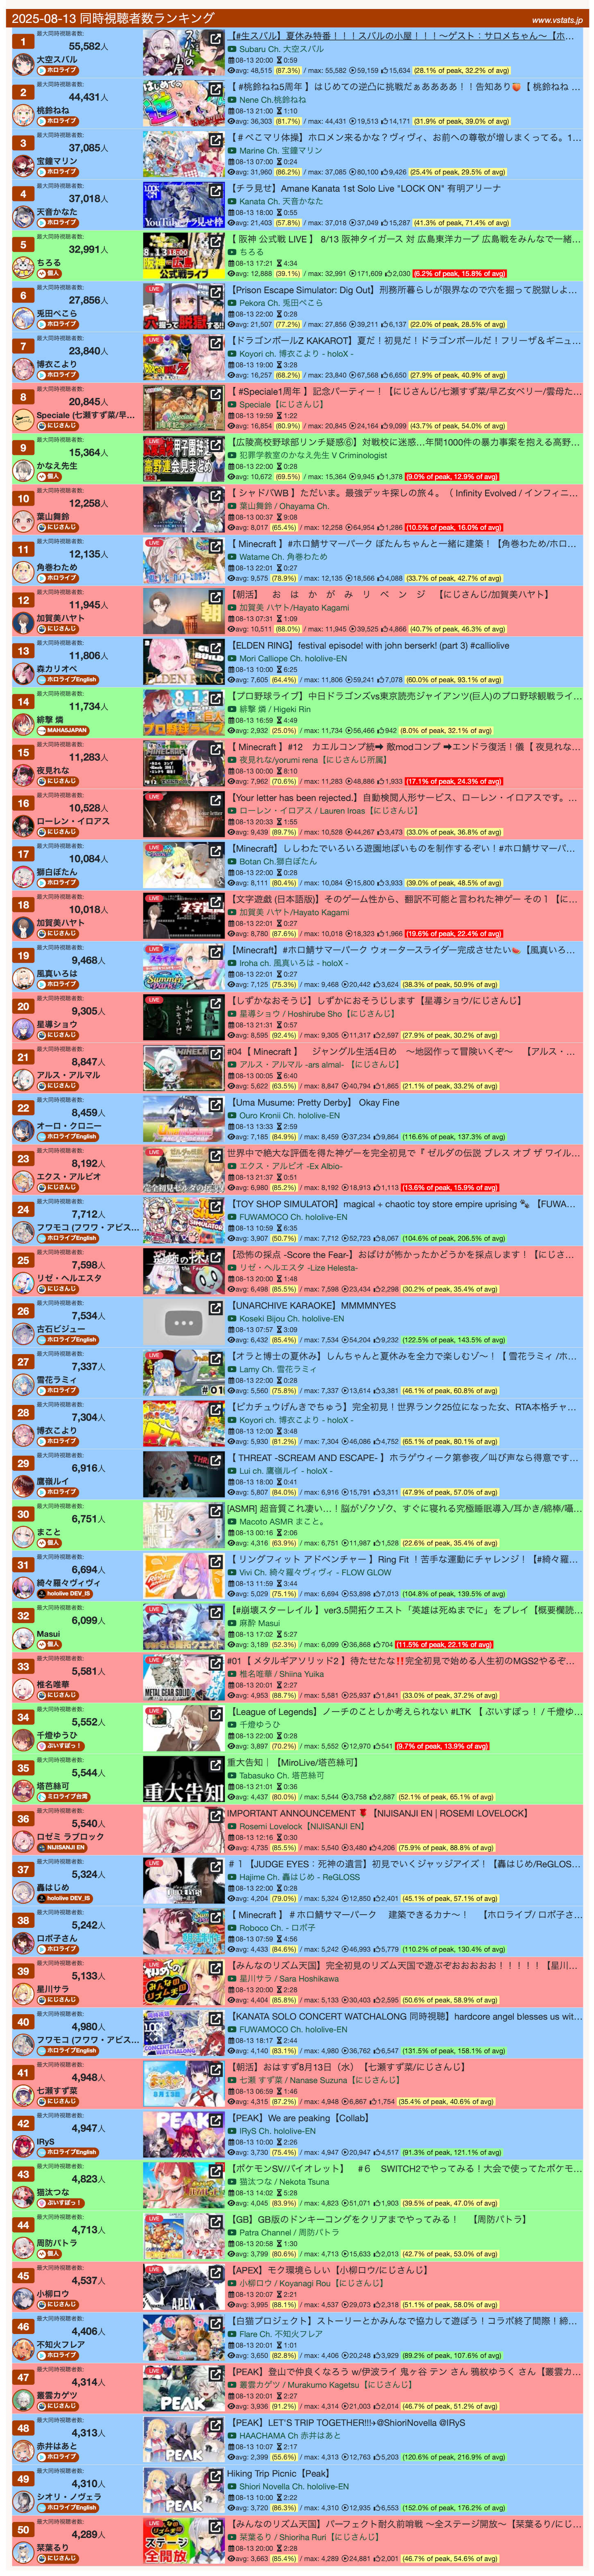
Now, here is an interesting visualisation on vstats data
>pic related
Here is the script to reproduce it
>(function() {
> // Select all stream elements with the specified class
> const streamElements = document.querySelectorAll('.d-flex.py-1.border-bottom');
>
> // Agency names in English and Japanese, including branches
> const nijisanjiNames = [
> 'nijisanji', 'にじさんじ',
> 'nijisanji en', 'nijisanji id', 'nijisanji kr', 'nijisanji jp',
> 'にじさんじ en', 'にじさんじ id', 'にじさんじ kr', 'にじさんじ jp'
> ];
> const hololiveNames = [
> 'hololive', 'ホロライブ',
> 'hololive en', 'hololive id', 'hololive jp',
> 'ホロライブ en', 'ホロライブ id', 'ホロライブ jp'
> ];
>
> streamElements.forEach(element => {
> // Get text content for agency detection
> const textContent = element.textContent.toLowerCase();
> let backgroundColor = '#99FF99'; // Light green for others
>
> // Check for Nijisanji
> if (nijisanjiNames.some(name => textContent.includes(name))) {
> backgroundColor = '#FF9999'; // Light red
> }
> // Check for Hololive
> else if (hololiveNames.some(name => textContent.includes(name))) {
> backgroundColor = '#99CCFF'; // Light blue
> }
>
> // Apply background color to the stream element
> element.style.setProperty('background-color', backgroundColor, 'important');
>
> // Get likes and avg/max elements
> const likesElement = element.querySelector('span[title="高評価数"]');
> const avgMaxElement = element.querySelector('span.text-nowrap[title="平均視聴者数/最大視聴者数"] span.d-none.d-sm-inline');
>
> if (likesElement && avgMaxElement) {
> // Extract likes text (excluding element)
> const likesText = Array.from(likesElement.childNodes)
> .filter(node => node.nodeType === Node.TEXT_NODE)
> .map(node => node.textContent.trim())
> .join('');
> const likes = parseInt(likesText.replace(/,/g, ''), 10);
>
> // Extract average and max from avg/max text (e.g., "avg: 3,357 / max: 4,534")
> const avgMaxText = Array.from(avgMaxElement.childNodes)
> .filter(node => node.nodeType === Node.TEXT_NODE)
> .map(node => node.textContent.trim())
> .join('');
> const avgMatch = avgMaxText.match(/avg:\s*([\d,]+)/i);
> const maxMatch = avgMaxText.match(/max:\s*([\d,]+)/i);
> const average = avgMatch ? parseInt(avgMatch[1].replace(/,/g, ''), 10) : null;
> const peak = maxMatch ? parseInt(maxMatch[1].replace(/,/g, ''), 10) : null;
>
> // Calculate percentages for likes and append with conditional highlighting
> if (!isNaN(likes) && !isNaN(peak) && peak > 0 && !isNaN(average) && average > 0) {
> const peakPercentage = ((likes / peak) * 100).toFixed(1); // Round to 1 decimal
> const avgPercentage = ((likes / average) * 100).toFixed(1); // Round to 1 decimal
> // Create a span for percentages with conditional background and font color
> const percentSpan = document.createElement('span');
> // Apply highlight based on the maximum of the two percentages
> const maxPercent = Math.max(parseFloat(peakPercentage), parseFloat(avgPercentage));
> if (maxPercent > 100) {
> percentSpan.style.backgroundColor = '#99FF99'; // Green for >100%
> percentSpan.style.color = '#000000'; // Black text for readability
> } else if (maxPercent < 25) {
> percentSpan.style.backgroundColor = '#FF0000'; // Full red for <25%
> percentSpan.style.color = '#FFFFFF'; // White text for readability
> } else {
> percentSpan.style.backgroundColor = '#FFFF99'; // Yellow for 25%–100%
> percentSpan.style.color = '#000000'; // Black text for readability
> }
> percentSpan.innerHTML = ` (${peakPercentage}% of peak, ${avgPercentage}% of avg) `;
> likesElement.appendChild(percentSpan);
> }
>
> // Update avg/max text with average percentage, preserving
> if (!isNaN(average) && !isNaN(peak) && peak > 0) {
> const avgPeakPercentage = ((average / peak) * 100).toFixed(1); // Round to 1 decimal
> const newAvgMaxText = avgMaxText.replace(
> /avg:\s*([\d,]+)/,
> `avg: $1 (${avgPeakPercentage}%) `
> );
> avgMaxElement.innerHTML = `${newAvgMaxText}`;
> }
> }
> });
>})();