Well it took about 5 hours but I managed to finish my indicator, I actually hate the way Pine does indexing ... close[0] is the far right bar, so if you have to iterate something, it's always decreasing as you move right. The bars themselves are indexed with [0] being to the left, so that bar_index is like 5000 on the far right. Awful.
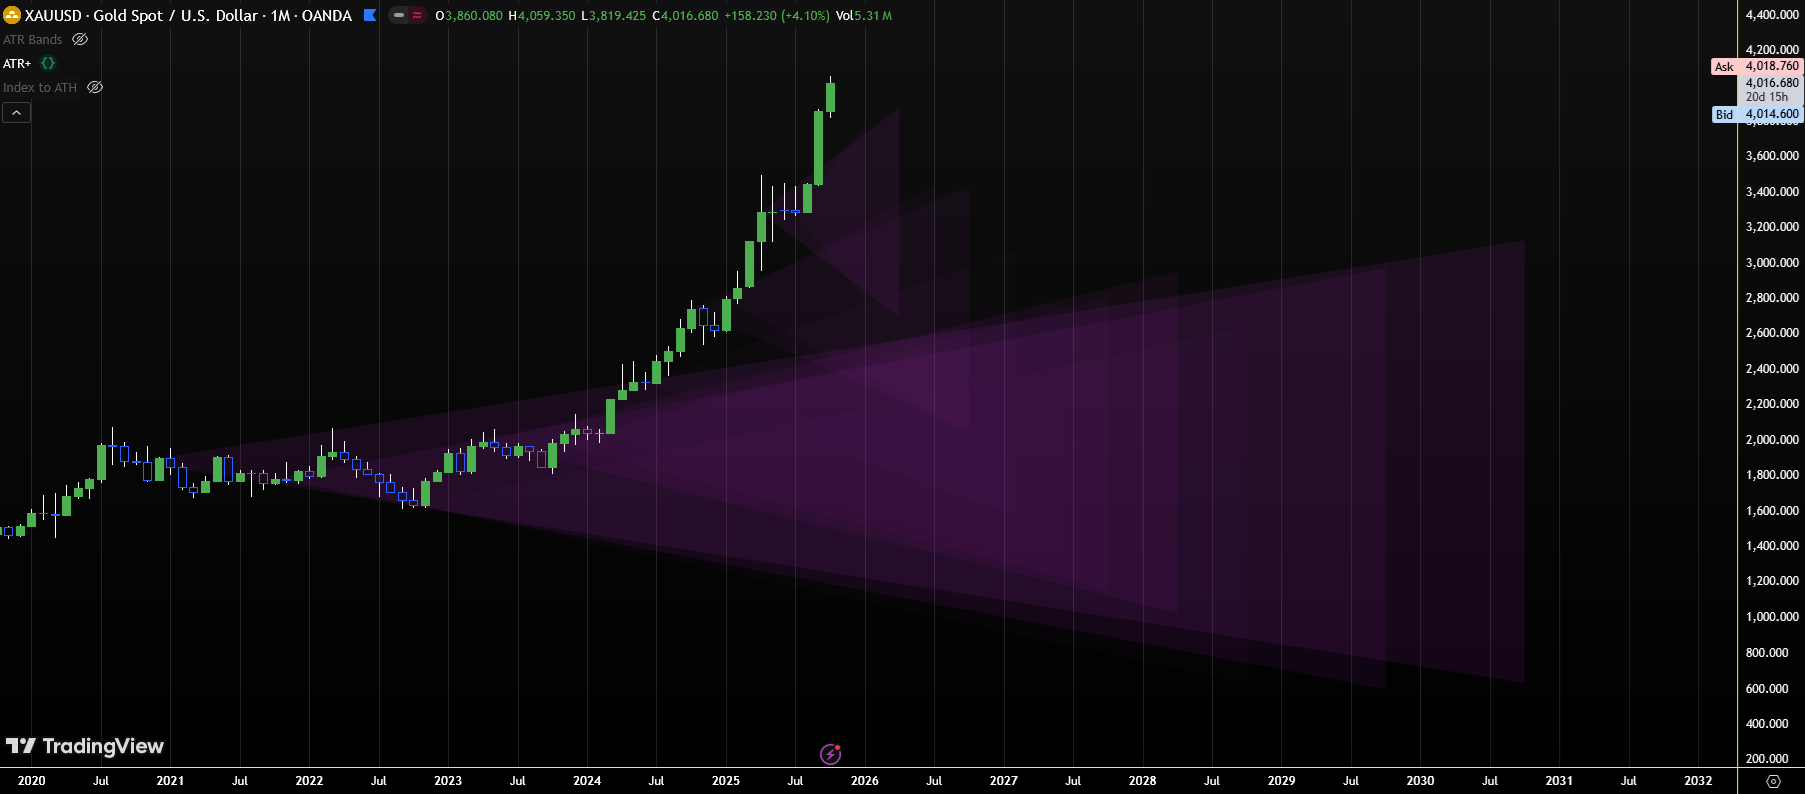
So basically the way it works is that it slaps down a forward volatility cone based on ATR, and I've arbitrarily put it at 3, 6, 9, 12, 16, 20, 24, 30, 36,48, 60 months to give a range over 5 years.
Within that cone, every candle is scored; each OHLC value is assigned a value of 1.0 if it's dead middle in the cone, and 0.0 as it approaches or passes the outside. A candle has a maximum of 1.00 score. Each cone then receives a score, with 100% being every candle being dead center. This affects how bright the cone is when rendering it.
So as you can see on the gold monthly chart, it >implies that we will see gold at 2100 to 2600 assuming it reverts to the mean in exactly one year from now