>>938711604
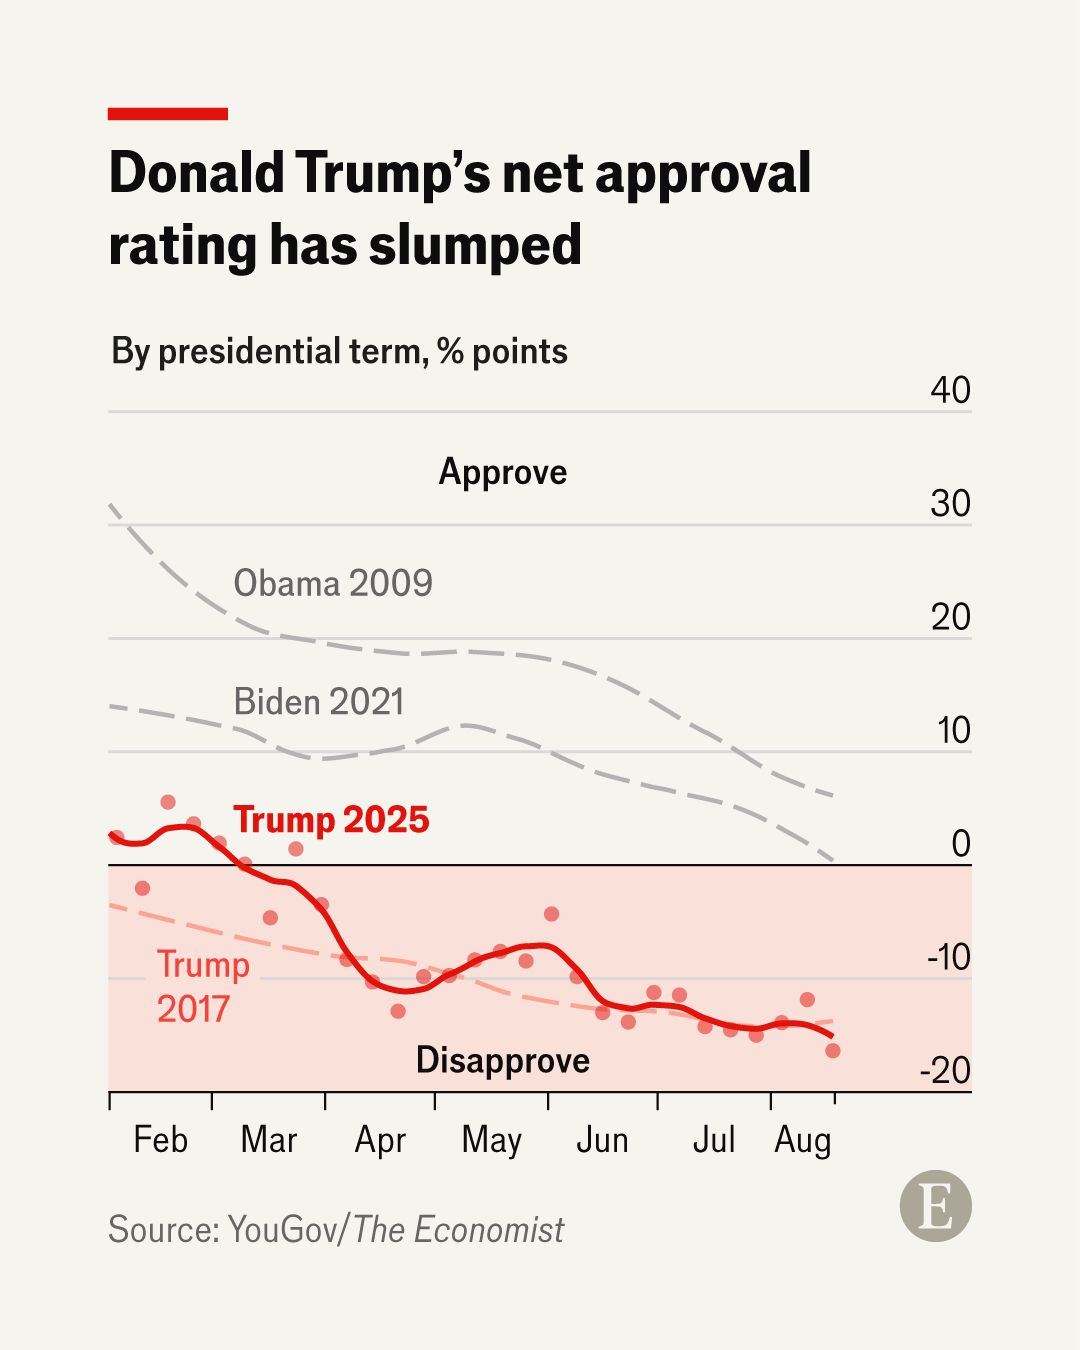
>without showing the real value, just the change from february when they got elected
wow. where to start.
first- presidential elections happen in November, not February.
second- the graph starts at Jan 20, the daye each president is inaugurated into office, aka the official start of their term.
third- why do we need the actual value when it's plotted against several others and we can see it in relation to the others? the change in rating is what the graph is showing, not the actual values because they mean very little
good lord, get an education. for the betterment of the entire planet.