>>42388305
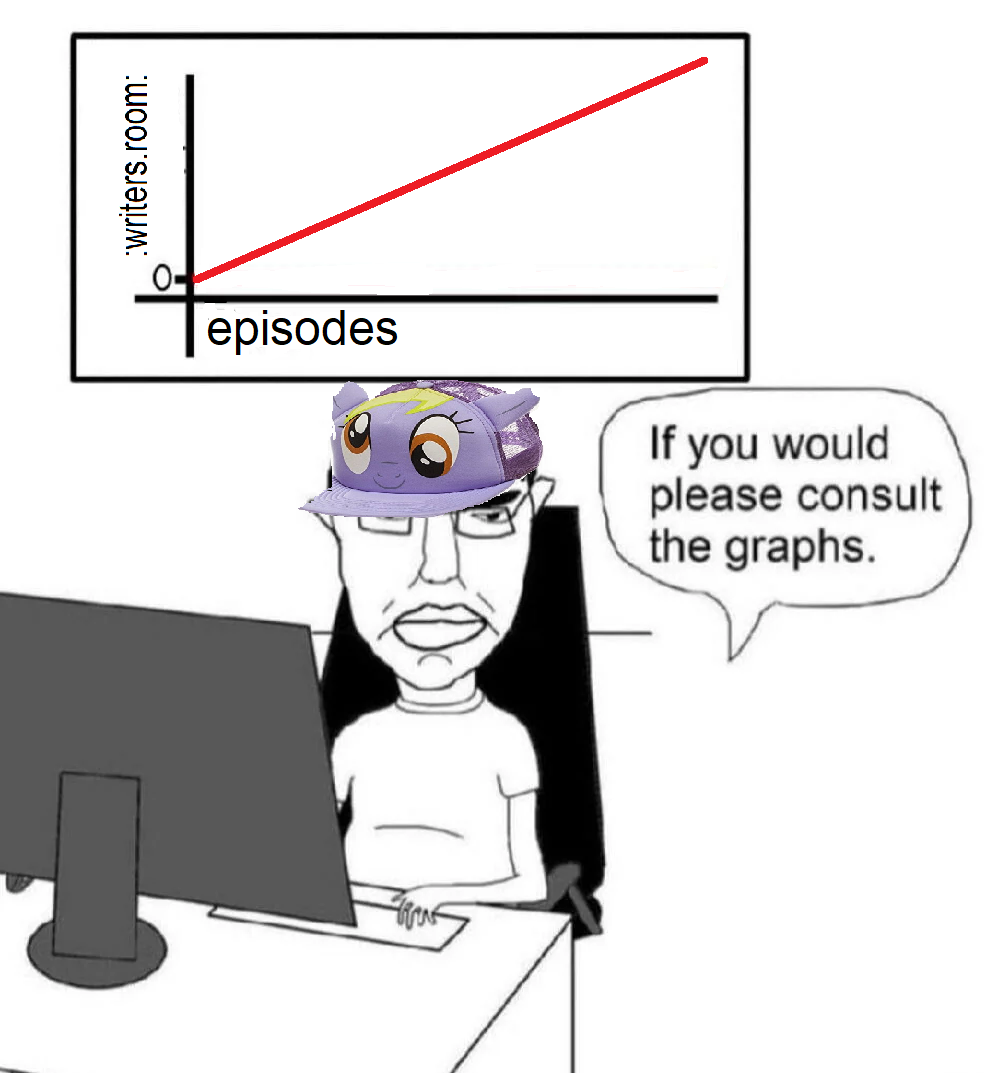
Basic knowledge isn't autism. Because it is linear, your graph represents a static increase in writer's rooms. As a simple explanation, it means that when you are for example at episode 4, you have 2 writer's rooms (example values because your graph has no numbering), but when you're at episode 8, you have 4. There's no direct correlation between a later episode and an increase in the frequency of writer's rooms relative to any previous episodes in your idiotic graph. It should be a line curving upwards if you want it to represent that.
I studied statistics but even a middle schooler would know this. Not even going to address the ambiguity in "episodes".
God faustfags are pathetic.