Search Results
6/13/2025, 8:26:16 PM
>>17761786
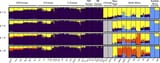
>retard, the y axis in the graph represents percentages divided in sections of 10% (0.1 = 10%, 0.2 = 20% and so on), meaning that you just, QUITE LITERALLY, proved to me that the average for iberia is 12% if you include portuguese
nope, failed gatcha attempt, it's not 100%, the y axis goes up to 50%, otherwise tuscans would be 60% east med, but you see from their admixture charts that they're 25%, that can only make sense if the y axis goes up to 50%
the green line that i used is exactly 10%, and the spa, average of iberia, is less than 10%, so you are completely wrong, even this study estimates iberians as having less than 10% nafri ancestry on average
you lost the argument, i demonstrated that the average iberian in that study is less than 10% nafri
Page 1