Search Results
ID: QVMghzbL/pol/508185444#508185693
6/21/2025, 1:47:12 PM
>>508185444
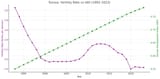
Here is the combined graph showing Tunisia’s Total Fertility Rate and HDI (1993–2023):
Fertility Rate (left axis):
Declines sharply from over 3.0 to around 1.83 births per woman.
Stabilized briefly in the 2000s–2010s, but resumed downward after 2015.
HDI (right axis):
Rises steadily from ~0.55 to ~0.78 — a clear upward trajectory, reflecting gains in education, health, and income.
Key Insight:
There is a strong inverse relationship:
As Tunisia’s HDI increases, its fertility declines — a classic demographic development pattern.
This highlights a powerful truth: human development leads to fewer children, even in historically higher-fertility societies like Tunisia.
Would you like to see this relationship plotted across multiple countries for comparison?
?sorry for delay - 4c gay timer
Page 1