Search Results
ID: QVMghzbL/pol/508185444#508185811
6/21/2025, 1:49:26 PM
>>508185444
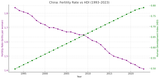
Here is the graph showing China’s Total Fertility Rate and HDI (1993–2023):
Fertility Rate (left axis):
Starts already low (~1.84 in 1993), and declines gradually to ~1.41 in 2023.
China never returned to replacement-level fertility after the one-child policy.
HDI (right axis):
Significant rise from ~0.50 to ~0.79 — a dramatic improvement in life expectancy, education, and income over 30 years.
Key Insight:
China mirrors Tunisia in the inverse HDI–fertility relationship:
As China’s HDI grew rapidly, its fertility declined and stayed low.
The development paradox deepens: higher standards of living tend to discourage reproduction, even in traditionally high-fertility cultures.
Would you like to overlay GDP per capita or compare both countries directly on the same chart?
Page 1