Search Results

7/2/2025, 2:41:26 AM
>>509266009
Will the others respond to your graph with the same questions?
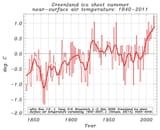
Your graph uses an x axis of years before present. It says 95 years before present. In fact that is still wrong, as the data ends in 1950, so 95 years before present is 1855.
Will the others respond to your graph with the same questions?
Your graph uses an x axis of years before present. It says 95 years before present. In fact that is still wrong, as the data ends in 1950, so 95 years before present is 1855.
Page 1