Search Results
7/9/2025, 9:36:37 AM
>>280381941
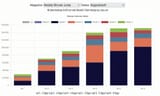
so if volume 8 sells 155800 for example the graph still goes up. that's a retarded graphic, it would shows increase instead of decline
why did you pick that metric when sales paints a better picture?
so if volume 8 sells 155800 for example the graph still goes up. that's a retarded graphic, it would shows increase instead of decline
why did you pick that metric when sales paints a better picture?
Page 1