I did
>systemd-analyze blame
>systemd-analyze plot > chart.svg
which weren't really helpful because it just told me it's the firmware step.
I now tried this
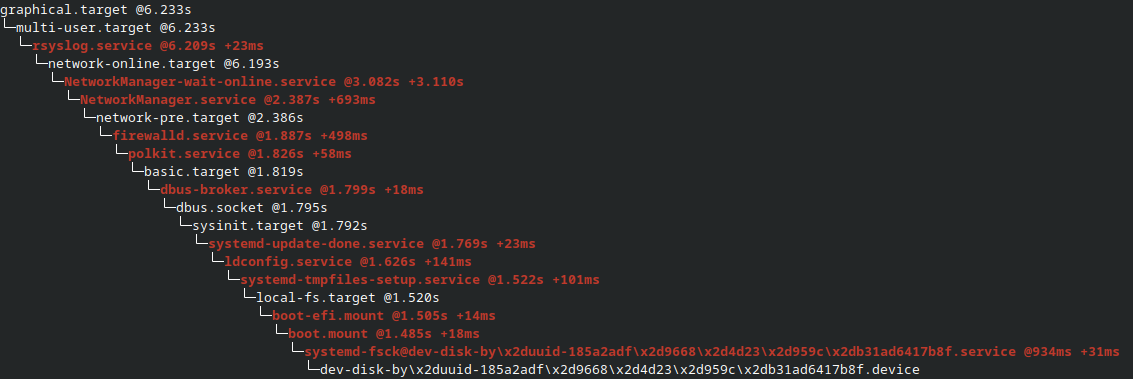
>systemd-analyze critical-chain
I'm not sure I'm reading it right but I just see
>123ms
added for each step, where is the 59s?